posted at 2022.1.17 13:29 by Administrator
我们可以用微积分来计算函数定义曲线下的精确的面积,通常函数只有一个变量,其形式是y=F(x),函数定义的曲线下的面积是二维区域的面积,有些应用可能需要计算函数z=F(x,y)定义下的曲面下的三维体积,当然也可以计算高维函数定义的面积。
但不幸的是,有时候无法计算出函数的反导数。例如,函数的方程可能非常复杂;或者可能是一些物理过程产生的数据。因此我们不知道函数的方程,在这种情况下,我们无法使用微积分的方法,但可以使用数值积分方法。
数值积分是使用数值技术来逼近函数定义的曲线下的面积的过程。存在若干用于计算数值积分的方法。最简单明了的方法是牛顿-柯特斯公式(Newton-Cotes formula),最基本的Newton-Cotes formula是矩形法则和梯形法则。
蒙特卡罗积分法(Monte Carlo integration)是求解数值积分的另一种方法。程序在一个区域内均匀地生成一系列的伪随机点,并确定每个点是否均位于目标区域内。然后,程序使用目标区域内的点的百分比来估计该区域的总面积。例如,假设生成的点位于20×20的正方形内,因此其面积为400平方单位。如果37%的伪随机点位于阴影区域内,则该阴影区域的面积约为0.37×400=148平方单位。
下面即是一个运用此方法求解面积的C#示例:
<supportedRuntime version="v4.0" sku=".NETFramework,Version=v4.5" />
using System;using System.Drawing;using System.Windows.Forms;using System.Drawing.Drawing2D; namespace MonteCarloIntegration{ public partial class Form1 : Form { public Form1() { InitializeComponent(); } private const bool UseColor = true; // Variables to calculate the area. private long NumTestPoints, NumHits, NumMisses; private Random Rand = new Random(); // The area of interest. private const float Wxmin = -5; private const float Wxmax = 5; private const float Wymin = -5; private const float Wymax = 5; private const float Wwid = Wxmax - Wxmin; private const float Whgt = Wymin - Wymax; // A Bitmap to show the problem and test points. private Bitmap Bm; private Graphics Gr; // Prepare the Bitmap. private void Form1_Load(object sender, EventArgs e) { MakeBitmap(); } // Make the Bitmap and reset the area counts. private void MakeBitmap() { // Reset the area data. NumTestPoints = 0; NumHits = 0; NumMisses = 0; areaTextBox.Clear(); totalPointsTextBox.Clear(); // Make the Bitmap and Graphics object. Bm = new Bitmap( graphPictureBox.ClientSize.Width, graphPictureBox.ClientSize.Height); Gr = Graphics.FromImage(Bm); Gr.SmoothingMode = SmoothingMode.AntiAlias; // Scale to make the graph fit nicely. RectangleF worldRect = new RectangleF(Wxmin, Wymax, Wwid, Whgt); PointF[] devicePoints = { new PointF(0, 0), new PointF(graphPictureBox.ClientSize.Width, 0), new PointF(0, graphPictureBox.ClientSize.Height), }; Gr.Transform = new Matrix(worldRect, devicePoints); using (Pen thin_pen = new Pen(Color.Blue, 0)) { if (!UseColor) thin_pen.Color = Color.Black; // Define the shapes. RectangleF ellipseRect1 = new RectangleF(-2, -4, 4, 8); RectangleF ellipseRect2 = new RectangleF(-4, -2, 8, 4); RectangleF circleRect1 = new RectangleF(-1.7f, -1.7f, 3.4f, 3.4f); RectangleF circleRect2 = new RectangleF(-3, -1, 2, 2); RectangleF circleRect3 = new RectangleF(1, -1, 2, 2); // Fill the shapes. Brush insideBrush = Brushes.LightBlue; if (!UseColor) insideBrush = Brushes.Silver; Gr.FillEllipse(insideBrush, ellipseRect1); Gr.FillEllipse(insideBrush, ellipseRect2); Gr.FillEllipse(Brushes.White, circleRect1); Gr.FillEllipse(Brushes.White, circleRect2); Gr.FillEllipse(Brushes.White, circleRect3); // Draw the shapes. Gr.DrawEllipse(thin_pen, ellipseRect1); Gr.DrawEllipse(thin_pen, ellipseRect2); Gr.DrawEllipse(thin_pen, circleRect1); Gr.DrawEllipse(thin_pen, circleRect2); Gr.DrawEllipse(thin_pen, circleRect3); // Draw the X axis. if (UseColor) thin_pen.Color = Color.Red; else thin_pen.Color = Color.Black; const float tick = 0.2f; Gr.DrawLine(thin_pen, Wxmin, 0, Wxmax, 0); for (int x = (int)Wxmin; x <= Wxmax; x++) Gr.DrawLine(thin_pen, x, -tick, x, tick); // Draw the Y axis. Gr.DrawLine(thin_pen, 0, Wymin, 0, Wymax); for (int y = (int)Wymin; y <= Wymax; y++) Gr.DrawLine(thin_pen, -tick, y, tick, y); } // Display the image. graphPictureBox.Image = Bm; } // Perform the indicated number of trials. private void integrateButton_Click(object sender, EventArgs e) { Cursor = Cursors.WaitCursor; // See how far 1 pixel is in world coordinates. Matrix inverse = Gr.Transform; inverse.Invert(); PointF[] pts = { new PointF(0, 0), new PointF(1, 1), }; inverse.TransformPoints(pts); float dx = 2 * (pts[1].X - pts[0].X); float dy = -2 * (pts[1].Y - pts[0].Y); long numPoints = long.Parse(numPointsTextBox.Text); for (long i = 0; i < numPoints; i++) { // Pick a random point within the area of interest. float x = (float)(Wxmin + Rand.NextDouble() * Wwid); float y = (float)(Wymax + Rand.NextDouble() * Whgt); // See if it's in the shape. if (PointIsInShape(x, y)) { if (UseColor) Gr.FillRectangle(Brushes.Blue, x, y, dx, dy); else Gr.FillRectangle(Brushes.Black, x, y, dx, dy); NumHits++; } else { if (UseColor) Gr.FillRectangle(Brushes.Red, x, y, dx, dy); else Gr.FillRectangle(Brushes.Gray, x, y, dx, dy); NumMisses++; } } NumTestPoints += numPoints; graphPictureBox.Refresh(); // Calculate the area. float area = Wwid * -Whgt * NumHits / (float)NumTestPoints; areaTextBox.Text = area.ToString(); totalPointsTextBox.Text = NumTestPoints.ToString(); Console.WriteLine("Points: " + NumTestPoints.ToString()); Console.WriteLine("Hits: " + NumHits.ToString()); Console.WriteLine("Misses: " + NumMisses.ToString()); Console.WriteLine("Area: " + area.ToString()); Console.WriteLine(""); Cursor = Cursors.Default; } // Return true if the point is inside the shape. private bool PointIsInShape(float x, float y) { // See if it is inside all of the ellipses. if ((x * x / 4.0 + y * y / 16.0 > 1.0) && (x * x / 16.0 + y * y / 4.0 > 1.0)) return false; // See if it is inside any circle. if (x * x + y * y < 1.7 * 1.7) return false; if ((x + 2) * (x + 2) + y * y < 1) return false; if ((x - 2) * (x - 2) + y * y < 1) return false; return true; } // Reset. private void resetButton_Click(object sender, EventArgs e) { MakeBitmap(); }
}
}
namespace MonteCarloIntegration
{
static class Program
{
/// <summary>
/// The main entry point for the application.
/// </summary>
[STAThread]
static void Main()
{
Application.EnableVisualStyles();
Application.SetCompatibleTextRenderingDefault(false);
Application.Run(new Form1());
}
}
}
效果图:
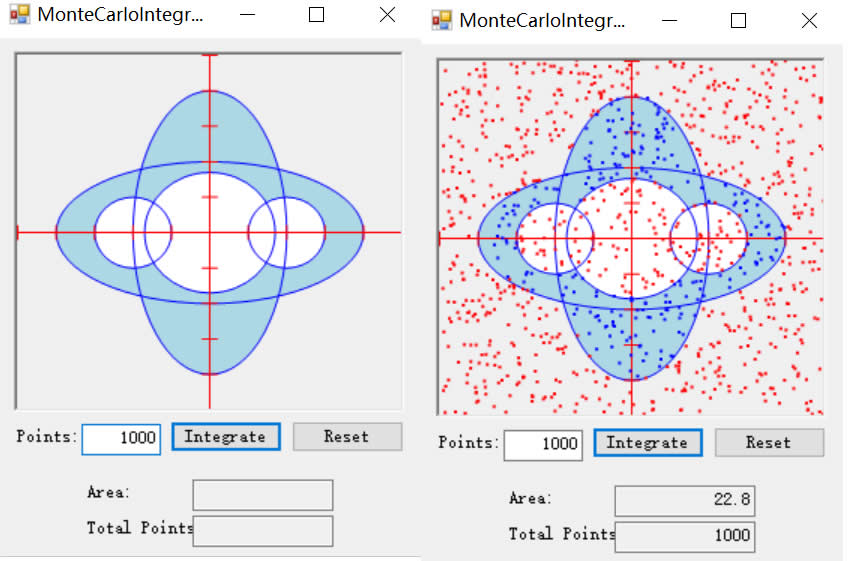
蒙特卡罗积分法通常比梯形积分法更容易产生误差,然而,有时蒙特卡罗积分法更容易实现,因为它不需要我们了解正在测量的形状的本质,我们只需在形状上生成点,然后检查有多少命中目标。
19e3c39c-b70f-4a6d-9935-c6013c02bead|0|.0|96d5b379-7e1d-4dac-a6ba-1e50db561b04
Tags: app, C#, 程序, 方法, 数据, 物理
IT技术